

Canada
Gambling.com Group Limited Reports Third Quarter 2021 Financial Results
Gambling.com Group Limited, a leading provider of digital marketing services active exclusively in the global online gambling industry, today announced its operating and financial results for the third quarter ended September 30, 2021.
Third Quarter 2021 Financial Highlights
- Revenue of $10.1 million grew 37% compared to $7.4 million in the same period for the prior year
- Net income of $4.7 million, or $0.13 per diluted share, compared to a net income of $2.3 million, or $0.08 per diluted share, in the same period for the prior year
- Adjusted EBITDA of $3.5 million decreased 14% compared to $4.0 million in the same period for the prior year, representing an Adjusted EBITDA margin of 34%1
- Free cash flow of $0.8 million decreased 81% compared to $3.9 million in the same period for the prior year2
Third Quarter 2021 Business Highlights
- Completed successful public listing of common shares on the Nasdaq Global Market under the ticker symbol “GAMB”
- Announced appointment of Mr. Daniel D’Arrigo to Board of Directors
- Received temporary supplier license from the Arizona Department of Gaming to provide marketing services to licensed operators in the state and launched free-to-use comparison of legal online sports betting services on BetArizona.com
- Launches of Marylandbets.com, casinosource.nl and gambling.com/nl providing bettors in Maryland and the Netherlands with trusted and up to date gambling information to help them place safe and secure legal wagers
- Completed acquisition of domains suitable for targeting the US market
“Our financial performance in the third quarter remained strong as we grew revenue by 37% compared to the prior year and, despite the third quarter being the seasonally slowest quarter of the year, delivered an Adjusted EBITDA margin of 34%,” said Charles Gillespie, Chief Executive Officer and co-founder of Gambling.com Group. “Importantly, after the quiet summer months of July and August, we delivered all-time-high revenue in September. With the launch of Arizona and the kickoff of the NFL season, we saw a significant uplift in U.S. revenue in September and our U.S. performance exceeded our internal expectations. Entering the quarter with good momentum we are encouraged by the start to our seasonally stronger fourth quarter. We remain highly focused on prudently growing the Company through both sustained organic growth and future accretive acquisitions which we continue to actively pursue”
1 Adjusted figures represent non-IFRS information. See “Non-IFRS Financial Measures” and the tables at the end of this release for an explanation of the adjustments and reconciliations to the comparable IFRS numbers.
2 Adjusted figures represent non-IFRS information. See “Non-IFRS Financial Measures” and the tables at the end of this
release for an explanation of the adjustments and reconciliations to the comparable IFRS numbers.
Third Quarter 2021 vs. Third Quarter 2020 Financial Highlights
|
|
|
THREE MONTHS ENDED |
|
|
CHANGE |
|
||||||||||
|
|
|
2021 |
|
|
2020 |
|
|
$ |
|
|
% |
|
||||
|
|
|
(in thousands USD, except for |
|
|
|
|
|
|
|
|||||||
|
CONSOLIDATED STATEMENTS OF |
|
|||||||||||||||
|
Revenue |
|
$ |
10,123 |
|
|
$ |
7,406 |
|
|
$ |
2,717 |
|
|
|
37 |
% |
|
Operating expenses |
|
|
(7,722 |
) |
|
$ |
(3,931 |
) |
|
$ |
(3,791 |
) |
|
|
96 |
% |
|
Operating profit |
|
|
2,401 |
|
|
|
3,475 |
|
|
|
(1,074 |
) |
|
|
(31 |
)% |
|
Income before tax |
|
|
2,694 |
|
|
|
2,609 |
|
|
|
85 |
|
|
|
3 |
% |
|
Net income for the period attributable to the |
|
$ |
4,675 |
|
|
$ |
2,303 |
|
|
$ |
2,372 |
|
|
|
103 |
% |
|
Net income per share attributable to ordinary |
|
|
0.14 |
|
|
|
0.08 |
|
|
|
0.06 |
|
|
|
75 |
% |
|
Net income per share attributable to ordinary |
|
|
0.13 |
|
|
|
0.08 |
|
|
|
0.05 |
|
|
|
63 |
% |
n/m = not meaningful
|
|
|
THREE MONTHS ENDED |
|
|
CHANGE |
|
||||||||||
|
|
|
2021 |
|
|
2020 |
|
|
$ |
|
|
% |
|
||||
|
|
|
(in thousands USD, unaudited) |
|
|
|
|
|
|
|
|||||||
|
NON-IFRS FINANCIAL MEASURES |
|
|
|
|
|
|
|
|
|
|
|
|
||||
|
Adjusted EBITDA |
|
$ |
3,464 |
|
|
$ |
4,027 |
|
|
$ |
(563 |
) |
|
|
(14 |
)% |
|
Adjusted EBITDA Margin |
|
|
34 |
% |
|
|
54 |
% |
|
n/m |
|
|
n/m |
|
||
|
Free Cash Flow |
|
|
754 |
|
|
|
3,917 |
|
|
|
(3,163 |
) |
|
|
(81 |
)% |
n/m = not meaningful
|
|
|
THREE MONTHS ENDED |
|
|
CHANGE |
|
||||||||||
|
|
|
2021 |
|
|
2020 |
|
|
Amount |
|
|
% |
|
||||
|
|
|
(in thousands, unaudited) |
|
|
|
|
|
|
|
|||||||
|
OTHER SUPPLEMENTAL DATA |
|
|
|
|
|
|
|
|
|
|
|
|
||||
|
New Depositing Customers (1) |
|
|
27 |
|
|
|
28 |
|
|
|
(1 |
) |
|
|
(4 |
)% |
(1) We define New Depositing Customers, or NDCs, as unique referral of a player from our system to one of our customers that satisfied an agreed metric (typically making a deposit above a minimum threshold) with the customer, thereby triggering the right to a commission for us.
|
|
|
AS OF |
|
AS OF |
|
CHANGE |
||
|
|
|
2021 |
|
2020 |
|
$ |
|
% |
|
|
|
(Unaudited) |
|
|
|
|
|
|
|
|
|
(in thousands, USD) |
|
|
|
|
||
|
CONSOLIDATED STATEMENTS OF FINANCIAL |
|
|
|
|
|
|
|
|
|
Cash and cash equivalents |
|
$53,160 |
|
$8,225 |
|
$44,935 |
|
n/m |
|
Working capital (2) |
|
55,064 |
|
10,059 |
|
45,005 |
|
n/m |
|
Total assets |
|
91,648 |
|
45,383 |
|
46,265 |
|
n/m |
|
Total borrowings |
|
5,919 |
|
5,960 |
|
(41) |
|
n/m |
|
Total liabilities |
|
11,373 |
|
11,171 |
|
202 |
|
n/m |
|
Total equity |
|
80,275 |
|
34,212 |
|
46,063 |
|
n/m |
(2) Working capital is defined as total current assets minus total current liabilities.
n/m = not meaningful
Revenue
Total revenue in the third quarter increased 37% to $10.1 million compared to $7.4 million in the comparable period for the prior year. On a constant currency basis, revenue increased $2.3 million, or 30%. The increase was driven by improved monetization of NDCs that we attribute to a combination of technology improvements and changes in product and market mix. NDCs decreased 4% to 27,000 compared to 28,000 in the prior year.
Our revenue disaggregated by market is as follows:
|
|
|
THREE MONTHS ENDED |
|
|
CHANGE |
|
||||||||||
|
|
|
2021 |
|
|
2020 |
|
|
$ |
|
|
% |
|
||||
|
|
|
(in thousands USD, unaudited) |
|
|
|
|
|
|
|
|||||||
|
U.K. and Ireland |
|
$ |
4,483 |
|
|
$ |
4,311 |
|
|
$ |
172 |
|
|
|
4 |
% |
|
Other Europe |
|
|
2,718 |
|
|
|
1,162 |
|
|
|
1,556 |
|
|
|
134 |
% |
|
North America |
|
|
2,270 |
|
|
|
1,081 |
|
|
|
1,189 |
|
|
|
110 |
% |
|
Rest of the world |
|
|
652 |
|
|
|
852 |
|
|
|
(200 |
) |
|
|
(23 |
)% |
|
Total revenues |
|
$ |
10,123 |
|
|
$ |
7,406 |
|
|
$ |
2,717 |
|
|
|
37 |
% |
Revenue increases were primarily driven by organic growth in our Other Europe and North American markets.
Our revenue disaggregated by monetization is as follows:
|
|
|
THREE MONTHS ENDED |
|
|
CHANGE |
|
||||||||||
|
|
|
2021 |
|
|
2020 |
|
|
$ |
|
|
% |
|
||||
|
|
|
(in thousands USD, unaudited) |
|
|
|
|
|
|
|
|||||||
|
Hybrid commission |
|
$ |
2,808 |
|
|
$ |
3,847 |
|
|
$ |
(1,039 |
) |
|
|
(27 |
)% |
|
Revenue share commission |
|
|
829 |
|
|
|
794 |
|
|
|
35 |
|
|
|
4 |
% |
|
CPA commission |
|
|
5,455 |
|
|
|
2,535 |
|
|
|
2,920 |
|
|
|
115 |
% |
|
Other revenue |
|
|
1,031 |
|
|
|
230 |
|
|
|
801 |
|
|
|
348 |
% |
|
Total revenues |
|
$ |
10,123 |
|
|
$ |
7,406 |
|
|
$ |
2,717 |
|
|
|
37 |
% |
Revenue increases were driven primarily by additional CPA commission and Other revenue. The increase in Other revenue was driven primarily by bonuses related to achieving certain operator NDC performance targets.
Our revenue disaggregated by product type from which it is derived is as follows:
|
|
|
THREE MONTHS ENDED |
|
|
CHANGE |
|
||||||||||
|
|
|
2021 |
|
|
2020 |
|
|
$ |
|
|
% |
|
||||
|
|
|
(in thousands USD, unaudited) |
|
|
|
|
|
|
|
|||||||
|
Casino |
|
$ |
7,965 |
|
|
$ |
6,354 |
|
|
$ |
1,611 |
|
|
|
25 |
% |
|
Sports |
|
|
2,076 |
|
|
|
858 |
|
|
|
1,218 |
|
|
|
142 |
% |
|
Other |
|
|
82 |
|
|
|
194 |
|
|
|
(112 |
) |
|
|
(58 |
)% |
|
Total revenues |
|
$ |
10,123 |
|
|
$ |
7,406 |
|
|
$ |
2,717 |
|
|
|
37 |
% |
Revenue increases were driven by growth in revenue from casino and sports products.
Operating Expenses
|
|
|
THREE MONTHS ENDED |
|
|
CHANGE |
|
||||||||||
|
|
|
2021 |
|
|
2020 |
|
|
$ |
|
|
% |
|
||||
|
|
|
(in thousands USD, unaudited) |
|
|
|
|
|
|
|
|||||||
|
Sales and marketing expenses |
|
$ |
3,587 |
|
|
$ |
1,790 |
|
|
$ |
1,797 |
|
|
|
100 |
% |
|
Technology expenses |
|
|
1,123 |
|
|
|
663 |
|
|
|
460 |
|
|
|
69 |
% |
|
General and administrative expenses |
|
|
2,978 |
|
|
|
1,402 |
|
|
|
1,576 |
|
|
|
112 |
% |
|
Allowance for credit losses and write offs |
|
|
34 |
|
|
|
76 |
|
|
|
(42 |
) |
|
|
(55 |
)% |
|
Total operating expenses |
|
$ |
7,722 |
|
|
$ |
3,931 |
|
|
$ |
3,791 |
|
|
|
96 |
% |
n/m = not meaningful
Total operating expenses increased by $3.8 million to $7.7 million compared to $3.9 million in the prior year. On a constant currency basis, operating expenses increased by $3.5 million to $7.7 million compared to $4.2 million in the prior year. The increase was driven primarily by headcount across Sales and Marketing, Technology, and General and Administrative functions as we invest in the Company’s organic growth initiatives as well as increased administrative expenses associated with operating as a public company.
Sales and Marketing expenses totaled $3.6 million compared to $1.8 million in the prior year. The increase was driven primarily by increased wages and salary expenses associated with increased headcount and professional services.
Technology expenses totaled $1.1 million compared to $0.7 million in the prior year. The increase was driven primarily by increased wages and salary expenses associated with increased headcount partially offset by capitalized development costs.
General and Administrative expenses totaled $3.0 million compared to $1.4 million in the prior year. The increase was driven primarily by increased wages and salary expenses associated with increased headcount, professional services, and insurance expenses.
Earnings
Adjusted EBITDA decreased by 14% to $3.5 million compared to $4.0 million in the prior year representing an Adjusted EBITDA margin of 34%. The decrease was driven primarily by increased operating expenses partly offset by increased revenue.
Operating profit in the third quarter decreased 31% to $2.4 million compared to $3.5 million in 2020. The decrease was driven primarily by a decrease in Adjusted EBITDA and an increase in share-based payments expense.
Net income in the third quarter totaled $4.7 million, or $0.13 per diluted share, compared to net income of $2.3 million, or $0.08 per diluted share, in the prior year. The increase was primarily driven by the recognition of deferred tax assets related to the transferred intangible assets.
Free Cash-flow
Total cash generated from operations of $1.4 million decreased 65% compared to $4.0 million in the prior year. The decrease was driven primarily by decreased adjusted EBITDA, the settlement of non-recurring IPO-related expenses and income tax payments. Free cash flow totaled $0.8 million compared to $3.9 million in the prior year. The decline was the result of decreased cash flow generated from operations and increased capital expenditures consisting primarily of the acquisition of domain names and capitalized development costs.
Balance Sheet
Cash balances as of September 30, 2021 totaled $53.2 million, an increase of $45.0 million compared to $8.2 million as of December 31, 2020. Working capital as of September 30, 2021 totaled $55.1 million, an increase of $45.0 million compared to $10.1 million as of December 31, 2020.
Total assets as of September 30, 2021 were $91.6 million compared to $45.4 million as of December 30, 2020. Total borrowings, including accrued interest, totaled $5.9 million compared to $6.0 million as of December 31, 2020. Total liabilities were $11.4 million compared to $11.2 million as of December 31, 2020.
Total equity as of September 30, 2021 was $80.3 million compared to $34.2 million as of December 31, 2020.
The increases in working capital, total assets, and total equity were driven primarily by the net proceeds received from the IPO and operating profit and net income generated by the Company.
2021 – 2023 Financial Targets
|
|
|
|
|
Total Revenue Growth |
|
> Average 40% |
|
Adjusted EBITDA Margin3 |
|
> Average 40% |
|
Leverage4 |
|
< Net Debt to Adjusted EBITDA 2.5x5 |
2021 Outlook
Elias Mark, Chief Financial Officer of Gambling.com Group, added, “Our third quarter results came in a bit above our expectations and after slow summer trading our financial performance accelerated in September to close out the quarter with the best month in the Company’s history. Our Adjusted EBITDA margin of 34% in the quarter was healthy despite a seasonally slow quarter and investments in scaling the organization for organic growth initiatives and operating as a public company. This is consistent with our prior guidance that our near-term margins may deviate from our average 40% target as we invest in our organic growth plan and pursue our M&A strategy. For the full year, we are reiterating our expectation to achieve both above 40% year-on-year organic revenue growth and approximately 40% Adjusted EBITDA margin. We remain in a very strong financial position after the IPO last quarter which offers us significant optionality going forward to execute our growth plan and each of our capital allocation priorities.”
Conference Call Details
|
|
|
|
|
Date/Time: |
|
Thursday, November 18, 2021, at 9:00 am EST |
|
Webcast: |
|
https://www.webcast-eqs.com/gamb20211118/en |
|
U.S. Toll-Free Dial In: |
|
877-407-0890 |
|
International Dial In: |
|
+1-201-389-0918 |
To access the call, please dial in approximately ten minutes before the start of the call. An accompanying slide presentation will be available in PDF format within the “News & Events” section of the Company’s website.

Independent slots studio Thunderkick has agreed a deal with Ontario-based operator Betty to supply the rapidly growing online casino with a diverse collection of globally popular titles.
Betty, an official partner of sporting franchises Toronto Maple Leafs and Toronto Raptors, has risen to prominence since its 2022 establishment, when it was built following the consultation of 300 casino players to create the optimal iGaming environment.
Distinguishing itself from North American competitors by catering specifically to slot enthusiasts rather than sports bettors, the operator has curated a portfolio of 2,800 games, hand-picked to deliver customers maximum entertainment value.
Thunderkick’s content is the latest to be integrated into Betty’s online casino, and the agreement will see a selection of its most popular titles, including The Wildos 2, Midas Golden Touch 3, and Esqueleto Explosivo 3, made available to a greater number of Ontarian players.
Thunderkick marked its debut in the Canadian province in Q2 of 2024, and has since partnered with a network of leading operators to improve its market position. The collaboration with Betty will further amplify its visibility in a key jurisdiction as the provider looks to reinforce its reputation as a global slot developer.
Svante Sahlström, CCO at Thunderkick, said: “It’s our mission at Thunderkick to go deeper, not wider, in 2025. That means forging meaningful, lasting relationships in target markets as opposed to securing as many commercial deals as possible.
“Since entering Ontario over 12 months ago, we have worked tirelessly to enhance our presence in the province, and working with leading brands such as Betty allows us to bring our unique games to a deeper pool of Canadian players.”
Paraskeva Smirnova, Casino Operations Manager at Betty, added: “Betty’s USP has always been our drive to build a slot portfolio with the very best titles from the industry’s most creative suppliers.
“Thunderkick’s passion for slot development is there for all to see, and the introduction of its games to our casino further elevates the consumer experience.”
The post Thunderkick commits to growth in Ontario with Betty partnership appeared first on Gaming and Gambling Industry in the Americas.
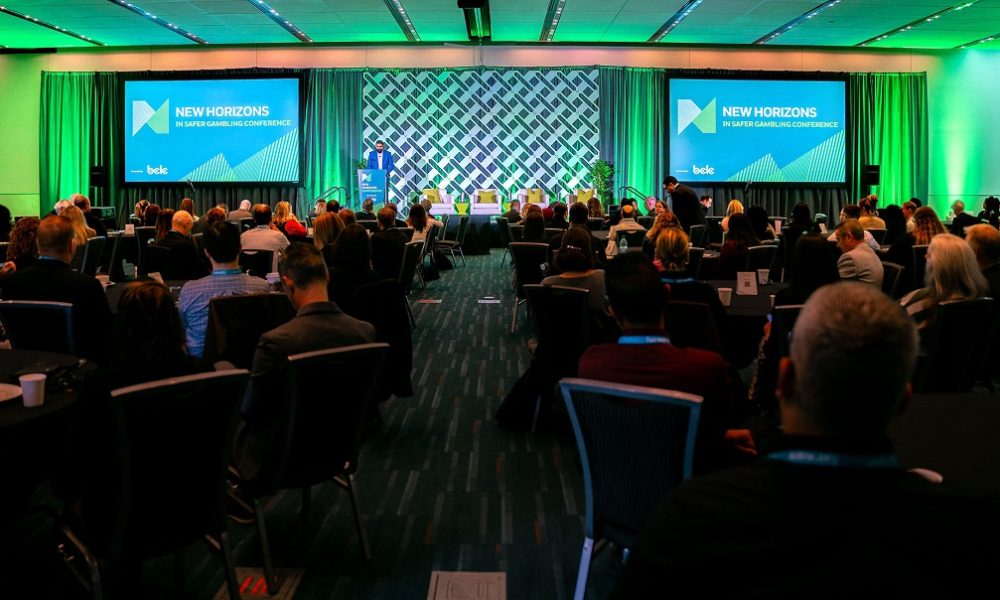
BCLC is pleased to announce the return of the New Horizons in Safer Gambling Conference, taking place November 2–4, 2026, at the JW Marriott Parq Vancouver.
This global event brings leading voices in research, policy and industry together to explore innovative approaches to safer gambling. Attendees can expect two days of forward-thinking dialogue, evidence-based insights and collaborative solutions to help shape the future of player health.
Sponsorship Opportunities Now Available
New to the 2026 conference, BCLC is excited to offer sponsorship opportunities to organizations that share BCLC’s passion for safer gambling. Benefits of sponsoring New Horizons 2026 include industry visibility, leadership recognition and meaningful engagement with a global audience. To learn more about sponsorship, please e-mail [email protected].
Registration and program details will be released later this fall.
The post Save the Date: BCLC’s New Horizons in Safer Gambling Conference Returns November 2026 appeared first on Gaming and Gambling Industry in the Americas.

Internet Gaming Operator by the Alcohol and Gaming Commission of Ontario (AGCO).
This significant milestone authorizes absolutebet to offer regulated iGaming services in Ontario’s legal market under the oversight of AGCO and iGaming Ontario (iGO).
The registration marks a key step in absolutebet’s mission to bring a trusted, responsible, and innovative online casino experience to Ontario players. absolutebet is committed to operating with integrity and transparency, meeting all provincial standards for player protection, responsible gambling, anti-money laundering, and game integrity.
“Securing AGCO registration is more than a milestone—it’s the start of absolutebet’s journey in one of the most exciting regulated markets in the world,” said Chen Truman, Founder of absolutebet. “We are building a brand that will grow with the Ontario community and set the stage for future expansion.”
On the regulatory milestone, Krisztina Kalla, Legal & Regulatory Compliance Advisor of absolutebet, commented: “I’m incredibly proud to see all the hard work behind this license pay off. Securing AGCO registration has taken months of preparation and close collaboration with regulators and partners. I am very happy to see the result of that work, and even more excited as we move into the launch phase and open up the absolutebet community to Ontario players in a fun and responsible way.”
Ontario is recognized as one of the most competitive and fast-growing regulated iGaming markets in North America. With AGCO registration secured, absolutebet will move forward with the final stages of its iGO onboarding process in preparation for launch.
The post absolutebet Secures AGCO Registration as an Internet Gaming Operator in Ontario appeared first on Gaming and Gambling Industry in the Americas.


California Gambling Control Commission Reviews Licensing and Ownership Transfers at September 18 Meeting
Groove Technologies and BetOnGames Forge Strategic Partnership
Week 37/2025 slot games releases

FBM® adds a new hero to its slots collection with Hippo’s Lock™ launch in Mexico
GR8 Tech’s Bet It Drives Wraps Season 1 with Stephen Crystal—From Las Vegas Legends to Global Gaming Leadership

TEAM VITALITY AND HUMMEL LAUNCH ALTERNATE JERSEY AND EXCLUSIVE APPAREL COLLECTION
SlotMatrix ignites the reels of West Virginia with Wild Extravaganza launch
GR8 Tech Launches CRM Bonus Shop to Boost Player Engagement and Retention

WSOP® PARADISE 2025 REVEALS FULL TOURNAMENT SCHEDULE WITH NEW EARLY-BIRD PACKAGES
Kambi Group plc signs on-property sportsbook partnership with the Oneida Indian Nation’s Turning Stone Enterprises
-

 gaming3 years ago
ODIN by 4Players: Immersive, state-of-the-art in-game audio launches into the next generation of gaming
-
EEG iGaming Directory9 years ago
iSoftBet continues to grow with new release Forest Mania
-
News8 years ago
Softbroke collaborates with Asia Live Tech for the expansion of the service line in the igaming market
-
News7 years ago
Super Bowl LIII: NFL Fans Can Bet on the #1 Sportsbook Review Site Betting-Super-Bowl.com, Providing Free Unbiased and Trusted News, Picks and Predictions
-
iGaming Industry8 years ago
Rick Meitzler appointed to the Indian Gaming Magazine Advisory Board for 2018
-
News7 years ago
REVEALED: Top eSports players set to earn $3.2 million in 2019
-
iGaming Industry8 years ago
French Senator raises Loot Boxes to France’s Gambling Regulator
-
News7 years ago
Exclusive Interview with Miklos Handa (Founder of the email marketing solutions, “MailMike.net”), speaker at Vienna International Gaming Expo 2018
