

Canada
Gambling.com Group Limited Reports Third Quarter 2021 Financial Results
Gambling.com Group Limited, a leading provider of digital marketing services active exclusively in the global online gambling industry, today announced its operating and financial results for the third quarter ended September 30, 2021.
Third Quarter 2021 Financial Highlights
- Revenue of $10.1 million grew 37% compared to $7.4 million in the same period for the prior year
- Net income of $4.7 million, or $0.13 per diluted share, compared to a net income of $2.3 million, or $0.08 per diluted share, in the same period for the prior year
- Adjusted EBITDA of $3.5 million decreased 14% compared to $4.0 million in the same period for the prior year, representing an Adjusted EBITDA margin of 34%1
- Free cash flow of $0.8 million decreased 81% compared to $3.9 million in the same period for the prior year2
Third Quarter 2021 Business Highlights
- Completed successful public listing of common shares on the Nasdaq Global Market under the ticker symbol “GAMB”
- Announced appointment of Mr. Daniel D’Arrigo to Board of Directors
- Received temporary supplier license from the Arizona Department of Gaming to provide marketing services to licensed operators in the state and launched free-to-use comparison of legal online sports betting services on BetArizona.com
- Launches of Marylandbets.com, casinosource.nl and gambling.com/nl providing bettors in Maryland and the Netherlands with trusted and up to date gambling information to help them place safe and secure legal wagers
- Completed acquisition of domains suitable for targeting the US market
“Our financial performance in the third quarter remained strong as we grew revenue by 37% compared to the prior year and, despite the third quarter being the seasonally slowest quarter of the year, delivered an Adjusted EBITDA margin of 34%,” said Charles Gillespie, Chief Executive Officer and co-founder of Gambling.com Group. “Importantly, after the quiet summer months of July and August, we delivered all-time-high revenue in September. With the launch of Arizona and the kickoff of the NFL season, we saw a significant uplift in U.S. revenue in September and our U.S. performance exceeded our internal expectations. Entering the quarter with good momentum we are encouraged by the start to our seasonally stronger fourth quarter. We remain highly focused on prudently growing the Company through both sustained organic growth and future accretive acquisitions which we continue to actively pursue”
1 Adjusted figures represent non-IFRS information. See “Non-IFRS Financial Measures” and the tables at the end of this release for an explanation of the adjustments and reconciliations to the comparable IFRS numbers.
2 Adjusted figures represent non-IFRS information. See “Non-IFRS Financial Measures” and the tables at the end of this
release for an explanation of the adjustments and reconciliations to the comparable IFRS numbers.
Third Quarter 2021 vs. Third Quarter 2020 Financial Highlights
|
|
|
THREE MONTHS ENDED |
|
|
CHANGE |
|
||||||||||
|
|
|
2021 |
|
|
2020 |
|
|
$ |
|
|
% |
|
||||
|
|
|
(in thousands USD, except for |
|
|
|
|
|
|
|
|||||||
|
CONSOLIDATED STATEMENTS OF |
|
|||||||||||||||
|
Revenue |
|
$ |
10,123 |
|
|
$ |
7,406 |
|
|
$ |
2,717 |
|
|
|
37 |
% |
|
Operating expenses |
|
|
(7,722 |
) |
|
$ |
(3,931 |
) |
|
$ |
(3,791 |
) |
|
|
96 |
% |
|
Operating profit |
|
|
2,401 |
|
|
|
3,475 |
|
|
|
(1,074 |
) |
|
|
(31 |
)% |
|
Income before tax |
|
|
2,694 |
|
|
|
2,609 |
|
|
|
85 |
|
|
|
3 |
% |
|
Net income for the period attributable to the |
|
$ |
4,675 |
|
|
$ |
2,303 |
|
|
$ |
2,372 |
|
|
|
103 |
% |
|
Net income per share attributable to ordinary |
|
|
0.14 |
|
|
|
0.08 |
|
|
|
0.06 |
|
|
|
75 |
% |
|
Net income per share attributable to ordinary |
|
|
0.13 |
|
|
|
0.08 |
|
|
|
0.05 |
|
|
|
63 |
% |
n/m = not meaningful
|
|
|
THREE MONTHS ENDED |
|
|
CHANGE |
|
||||||||||
|
|
|
2021 |
|
|
2020 |
|
|
$ |
|
|
% |
|
||||
|
|
|
(in thousands USD, unaudited) |
|
|
|
|
|
|
|
|||||||
|
NON-IFRS FINANCIAL MEASURES |
|
|
|
|
|
|
|
|
|
|
|
|
||||
|
Adjusted EBITDA |
|
$ |
3,464 |
|
|
$ |
4,027 |
|
|
$ |
(563 |
) |
|
|
(14 |
)% |
|
Adjusted EBITDA Margin |
|
|
34 |
% |
|
|
54 |
% |
|
n/m |
|
|
n/m |
|
||
|
Free Cash Flow |
|
|
754 |
|
|
|
3,917 |
|
|
|
(3,163 |
) |
|
|
(81 |
)% |
n/m = not meaningful
|
|
|
THREE MONTHS ENDED |
|
|
CHANGE |
|
||||||||||
|
|
|
2021 |
|
|
2020 |
|
|
Amount |
|
|
% |
|
||||
|
|
|
(in thousands, unaudited) |
|
|
|
|
|
|
|
|||||||
|
OTHER SUPPLEMENTAL DATA |
|
|
|
|
|
|
|
|
|
|
|
|
||||
|
New Depositing Customers (1) |
|
|
27 |
|
|
|
28 |
|
|
|
(1 |
) |
|
|
(4 |
)% |
(1) We define New Depositing Customers, or NDCs, as unique referral of a player from our system to one of our customers that satisfied an agreed metric (typically making a deposit above a minimum threshold) with the customer, thereby triggering the right to a commission for us.
|
|
|
AS OF |
|
AS OF |
|
CHANGE |
||
|
|
|
2021 |
|
2020 |
|
$ |
|
% |
|
|
|
(Unaudited) |
|
|
|
|
|
|
|
|
|
(in thousands, USD) |
|
|
|
|
||
|
CONSOLIDATED STATEMENTS OF FINANCIAL |
|
|
|
|
|
|
|
|
|
Cash and cash equivalents |
|
$53,160 |
|
$8,225 |
|
$44,935 |
|
n/m |
|
Working capital (2) |
|
55,064 |
|
10,059 |
|
45,005 |
|
n/m |
|
Total assets |
|
91,648 |
|
45,383 |
|
46,265 |
|
n/m |
|
Total borrowings |
|
5,919 |
|
5,960 |
|
(41) |
|
n/m |
|
Total liabilities |
|
11,373 |
|
11,171 |
|
202 |
|
n/m |
|
Total equity |
|
80,275 |
|
34,212 |
|
46,063 |
|
n/m |
(2) Working capital is defined as total current assets minus total current liabilities.
n/m = not meaningful
Revenue
Total revenue in the third quarter increased 37% to $10.1 million compared to $7.4 million in the comparable period for the prior year. On a constant currency basis, revenue increased $2.3 million, or 30%. The increase was driven by improved monetization of NDCs that we attribute to a combination of technology improvements and changes in product and market mix. NDCs decreased 4% to 27,000 compared to 28,000 in the prior year.
Our revenue disaggregated by market is as follows:
|
|
|
THREE MONTHS ENDED |
|
|
CHANGE |
|
||||||||||
|
|
|
2021 |
|
|
2020 |
|
|
$ |
|
|
% |
|
||||
|
|
|
(in thousands USD, unaudited) |
|
|
|
|
|
|
|
|||||||
|
U.K. and Ireland |
|
$ |
4,483 |
|
|
$ |
4,311 |
|
|
$ |
172 |
|
|
|
4 |
% |
|
Other Europe |
|
|
2,718 |
|
|
|
1,162 |
|
|
|
1,556 |
|
|
|
134 |
% |
|
North America |
|
|
2,270 |
|
|
|
1,081 |
|
|
|
1,189 |
|
|
|
110 |
% |
|
Rest of the world |
|
|
652 |
|
|
|
852 |
|
|
|
(200 |
) |
|
|
(23 |
)% |
|
Total revenues |
|
$ |
10,123 |
|
|
$ |
7,406 |
|
|
$ |
2,717 |
|
|
|
37 |
% |
Revenue increases were primarily driven by organic growth in our Other Europe and North American markets.
Our revenue disaggregated by monetization is as follows:
|
|
|
THREE MONTHS ENDED |
|
|
CHANGE |
|
||||||||||
|
|
|
2021 |
|
|
2020 |
|
|
$ |
|
|
% |
|
||||
|
|
|
(in thousands USD, unaudited) |
|
|
|
|
|
|
|
|||||||
|
Hybrid commission |
|
$ |
2,808 |
|
|
$ |
3,847 |
|
|
$ |
(1,039 |
) |
|
|
(27 |
)% |
|
Revenue share commission |
|
|
829 |
|
|
|
794 |
|
|
|
35 |
|
|
|
4 |
% |
|
CPA commission |
|
|
5,455 |
|
|
|
2,535 |
|
|
|
2,920 |
|
|
|
115 |
% |
|
Other revenue |
|
|
1,031 |
|
|
|
230 |
|
|
|
801 |
|
|
|
348 |
% |
|
Total revenues |
|
$ |
10,123 |
|
|
$ |
7,406 |
|
|
$ |
2,717 |
|
|
|
37 |
% |
Revenue increases were driven primarily by additional CPA commission and Other revenue. The increase in Other revenue was driven primarily by bonuses related to achieving certain operator NDC performance targets.
Our revenue disaggregated by product type from which it is derived is as follows:
|
|
|
THREE MONTHS ENDED |
|
|
CHANGE |
|
||||||||||
|
|
|
2021 |
|
|
2020 |
|
|
$ |
|
|
% |
|
||||
|
|
|
(in thousands USD, unaudited) |
|
|
|
|
|
|
|
|||||||
|
Casino |
|
$ |
7,965 |
|
|
$ |
6,354 |
|
|
$ |
1,611 |
|
|
|
25 |
% |
|
Sports |
|
|
2,076 |
|
|
|
858 |
|
|
|
1,218 |
|
|
|
142 |
% |
|
Other |
|
|
82 |
|
|
|
194 |
|
|
|
(112 |
) |
|
|
(58 |
)% |
|
Total revenues |
|
$ |
10,123 |
|
|
$ |
7,406 |
|
|
$ |
2,717 |
|
|
|
37 |
% |
Revenue increases were driven by growth in revenue from casino and sports products.
Operating Expenses
|
|
|
THREE MONTHS ENDED |
|
|
CHANGE |
|
||||||||||
|
|
|
2021 |
|
|
2020 |
|
|
$ |
|
|
% |
|
||||
|
|
|
(in thousands USD, unaudited) |
|
|
|
|
|
|
|
|||||||
|
Sales and marketing expenses |
|
$ |
3,587 |
|
|
$ |
1,790 |
|
|
$ |
1,797 |
|
|
|
100 |
% |
|
Technology expenses |
|
|
1,123 |
|
|
|
663 |
|
|
|
460 |
|
|
|
69 |
% |
|
General and administrative expenses |
|
|
2,978 |
|
|
|
1,402 |
|
|
|
1,576 |
|
|
|
112 |
% |
|
Allowance for credit losses and write offs |
|
|
34 |
|
|
|
76 |
|
|
|
(42 |
) |
|
|
(55 |
)% |
|
Total operating expenses |
|
$ |
7,722 |
|
|
$ |
3,931 |
|
|
$ |
3,791 |
|
|
|
96 |
% |
n/m = not meaningful
Total operating expenses increased by $3.8 million to $7.7 million compared to $3.9 million in the prior year. On a constant currency basis, operating expenses increased by $3.5 million to $7.7 million compared to $4.2 million in the prior year. The increase was driven primarily by headcount across Sales and Marketing, Technology, and General and Administrative functions as we invest in the Company’s organic growth initiatives as well as increased administrative expenses associated with operating as a public company.
Sales and Marketing expenses totaled $3.6 million compared to $1.8 million in the prior year. The increase was driven primarily by increased wages and salary expenses associated with increased headcount and professional services.
Technology expenses totaled $1.1 million compared to $0.7 million in the prior year. The increase was driven primarily by increased wages and salary expenses associated with increased headcount partially offset by capitalized development costs.
General and Administrative expenses totaled $3.0 million compared to $1.4 million in the prior year. The increase was driven primarily by increased wages and salary expenses associated with increased headcount, professional services, and insurance expenses.
Earnings
Adjusted EBITDA decreased by 14% to $3.5 million compared to $4.0 million in the prior year representing an Adjusted EBITDA margin of 34%. The decrease was driven primarily by increased operating expenses partly offset by increased revenue.
Operating profit in the third quarter decreased 31% to $2.4 million compared to $3.5 million in 2020. The decrease was driven primarily by a decrease in Adjusted EBITDA and an increase in share-based payments expense.
Net income in the third quarter totaled $4.7 million, or $0.13 per diluted share, compared to net income of $2.3 million, or $0.08 per diluted share, in the prior year. The increase was primarily driven by the recognition of deferred tax assets related to the transferred intangible assets.
Free Cash-flow
Total cash generated from operations of $1.4 million decreased 65% compared to $4.0 million in the prior year. The decrease was driven primarily by decreased adjusted EBITDA, the settlement of non-recurring IPO-related expenses and income tax payments. Free cash flow totaled $0.8 million compared to $3.9 million in the prior year. The decline was the result of decreased cash flow generated from operations and increased capital expenditures consisting primarily of the acquisition of domain names and capitalized development costs.
Balance Sheet
Cash balances as of September 30, 2021 totaled $53.2 million, an increase of $45.0 million compared to $8.2 million as of December 31, 2020. Working capital as of September 30, 2021 totaled $55.1 million, an increase of $45.0 million compared to $10.1 million as of December 31, 2020.
Total assets as of September 30, 2021 were $91.6 million compared to $45.4 million as of December 30, 2020. Total borrowings, including accrued interest, totaled $5.9 million compared to $6.0 million as of December 31, 2020. Total liabilities were $11.4 million compared to $11.2 million as of December 31, 2020.
Total equity as of September 30, 2021 was $80.3 million compared to $34.2 million as of December 31, 2020.
The increases in working capital, total assets, and total equity were driven primarily by the net proceeds received from the IPO and operating profit and net income generated by the Company.
2021 – 2023 Financial Targets
|
|
|
|
|
Total Revenue Growth |
|
> Average 40% |
|
Adjusted EBITDA Margin3 |
|
> Average 40% |
|
Leverage4 |
|
< Net Debt to Adjusted EBITDA 2.5x5 |
2021 Outlook
Elias Mark, Chief Financial Officer of Gambling.com Group, added, “Our third quarter results came in a bit above our expectations and after slow summer trading our financial performance accelerated in September to close out the quarter with the best month in the Company’s history. Our Adjusted EBITDA margin of 34% in the quarter was healthy despite a seasonally slow quarter and investments in scaling the organization for organic growth initiatives and operating as a public company. This is consistent with our prior guidance that our near-term margins may deviate from our average 40% target as we invest in our organic growth plan and pursue our M&A strategy. For the full year, we are reiterating our expectation to achieve both above 40% year-on-year organic revenue growth and approximately 40% Adjusted EBITDA margin. We remain in a very strong financial position after the IPO last quarter which offers us significant optionality going forward to execute our growth plan and each of our capital allocation priorities.”
Conference Call Details
|
|
|
|
|
Date/Time: |
|
Thursday, November 18, 2021, at 9:00 am EST |
|
Webcast: |
|
https://www.webcast-eqs.com/gamb20211118/en |
|
U.S. Toll-Free Dial In: |
|
877-407-0890 |
|
International Dial In: |
|
+1-201-389-0918 |
To access the call, please dial in approximately ten minutes before the start of the call. An accompanying slide presentation will be available in PDF format within the “News & Events” section of the Company’s website.

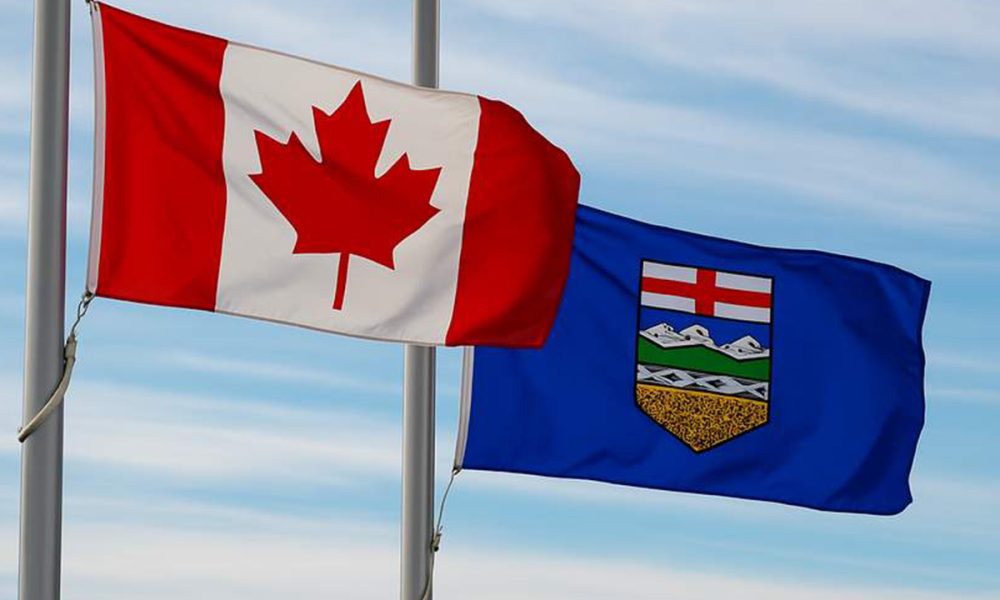
Law enforcement in Alberta continues to search for the last suspect in a sophisticated fraud operation that targeted ATMs in Edmonton-area casinos and resulted in over CAD 1 million ($720,487) in losses throughout Western Canada.
The Royal Canadian Mounted Police (RCMP) has confirmed that Hisham Ismaeel, 28, remains at large with a province-wide warrant for his arrest. He faces charges of fraud exceeding $5000 and possessing proceeds of crime. Police have already arrested four other men linked to the scheme. Investigators describe the operation as a well-planned effort to exploit financial systems and clean dirty money.
The accused, Elliot Miao, 42, Van Bau Ta, 39, Hassan Jaafar Haydar Ahmad, 37, and Dennis Jones, 42, showed up in the Alberta Court of Justice last week. They face charges from fraud and money laundering to owning criminal property. Miao also has a narcotics trafficking charge after police found cocaine when they searched with warrants.
Investigators claim the group made coordinated withdrawals at several casino ATMs, timing their transactions to avoid getting caught. This action messed up ATM networks in the area and showed flaws in the systems that banks and casinos use to stop misuse.
The RCMP Federal Policing Northwest Region led an investigation that involved six search warrants in Edmonton. The Edmonton Police Service, the Financial Transactions and Reports Analysis Centre of Canada (FINTRAC), Alberta Gaming, Liquor and Cannabis (AGLC), and several banks supported this effort. Officials said the case shows how teamwork between public agencies and the private sector plays a key role in combating modern financial crime.
AGLC representatives pointed out that casino operators in the province must follow strict reporting and surveillance rules under Canada’s anti-money laundering laws. The specific casinos affected remain unnamed, but the Edmonton region has seven licensed facilities. AGLC said its policies helped spot problems and backed the RCMP’s investigation.
Compliance experts say this fraud shows how criminals change their methods to take advantage of weak spots in reporting limits and transaction checks. They claim that casinos, which deal with lots of cash, are still easy targets unless they keep improving their detection systems and teach their front-line workers to notice coordinated actions like several big withdrawals happening one after another.
For now, the case highlights both the money and crime aspects of casino-related fraud. Besides the million-dollar losses, finding drugs during the raids points to a bigger criminal operation where financial crimes and drug dealing overlap.
The post Casino ATM Scam in Edmonton Reveals Money Laundering and Drug Links appeared first on Gaming and Gambling Industry in the Americas.

Bragg Gaming Group, a leading online gaming technology provider, has confirmed a major cybersecurity incident that compromised its internal IT infrastructure in the early hours of Saturday, August 16, 2025.
The company detected unauthorized intrusion attempts that successfully breached its internal network, triggering an immediate and comprehensive incident response.
Key Takeaways
-
Bragg Gaming Group experienced a cybersecurity breach involving access to internal IT systems.
-
No customer personal data or payment information appears to have been compromised.
-
The company has enacted full containment and investigation protocols.
Details of the Breach
According to a preliminary forensic analysis by Bragg’s internal security team, the attack was a targeted breach aimed at the company’s internal computer environment. While the exact method of intrusion is still under investigation, early indicators suggest a sophisticated exploit of internal network vulnerabilities.
Fortunately, the company’s customer-facing systems, including sensitive user data and financial information, appear to have been unaffected. Bragg’s existing encryption protocols and access control systems successfully prevented the attackers from accessing customer information.
Immediate Response Measures
In response to the breach, Bragg launched a multi-tiered containment strategy, including:
-
Network Segmentation to isolate affected systems
-
Enhanced Monitoring of data flows across its Remote Games Server (RGS) platform
-
Security Audits of critical infrastructure, including the Bragg Hub and PAM systems
-
Engagement of Independent Cybersecurity Experts to assist in incident analysis and system hardening
Bragg’s Security Operations Center has also elevated its alert level, initiating 24/7 monitoring across all server clusters and network endpoints. In addition, company-wide penetration testing is now underway to proactively identify any residual vulnerabilities.
Business Continuity Maintained
Despite the severity of the breach, Bragg reports that its operations remain unaffected. All gaming services, including iCasino and sportsbook offerings across regulated markets, continue to function without disruption.
“While this incident is deeply concerning, we are confident in the rapid and thorough response initiated by our team,” a company spokesperson stated. “We remain committed to protecting our infrastructure, our partners, and most importantly, our players.”
Looking Ahead
As part of its response, Bragg has also launched mandatory security awareness training for all employees to reinforce best practices and prevent future incidents.
Cybersecurity analysts will continue working with Bragg to determine the full scope of the attack, improve system resilience, and maintain the trust of its users and stakeholders.
Bragg’s handling of the incident highlights both the evolving nature of cybersecurity threats and the importance of robust, responsive defense systems in the digital gaming sector.
Source: cybersecuritynews.com
The post Bragg Confirms Cyber Attack – Hackers Access Internal IT Systems appeared first on Gaming and Gambling Industry in the Americas.
The Alcohol and Gaming Commission of Ontario (AGCO) has updated several lottery policies to remove the cap on seller commission for Paper Raffles and Media Bingo, along with removing the prohibition on Catch the Ace paper lotteries, to align with other charitable lottery products.
Licensed charities may now negotiate commissions directly with sellers and determine commissions, provided they are reasonable and tied to the cost of service provided by the seller.
These updates further the AGCO’s commitment to adopt an outcomes-based regulatory approach and reduce burden for the charitable gaming sector. Local charitable organizations will have greater flexibility to make decisions that best serve their fundraising objectives.
Important Reminders
• Charities must still receive approval for other expenses incurred under their licence and retain receipts for seller commission paid.
• Licensing authorities will not require documentation to be submitted as part of the application process, however, charities are still subject to audit to determine compliance.
• Charities are reminded of their legal requirement to meet their obligations under the Criminal Code and with respect to conducting and managing a charitable gaming scheme.
• As with all licensed charitable lottery events, charities must take the necessary steps to ensure that they are conducting and managing the lottery event within Ontario.
For charitable gaming-related inquiries, email an AGCO Eligibility Officer at [email protected] or call AGCO Customer Service at 1-800-522-2876, Monday to Friday from 8:30 a.m. to 5 p.m.
The post AGCO Removes Cap on Seller Commission for Charitable Lottery Products appeared first on Gaming and Gambling Industry in the Americas.

SlotMatrix ignites the reels of West Virginia with Wild Extravaganza launch

SlotMatrix ignites the reels of West Virginia with Wild Extravaganza launch
Bacta commissioned research shows huge support for seaside arcades led by Gen Z
Soft2Bet and Its Brands Land 12 Nominations at the EGR Operator Awards 2025
DATA.BET Secures Spot at SBC Summit 2025
Week 32/2025 slot games releases

Jackbit: The New Crypto Casino Shapes U.S. Gambling in 2025 with 7000 Games and No KYC
Galaxsys Expands Its Slot Portfolio with Gates of Asgard: Nine Realms

ZITRO’S LEGENDARY SWORD TAKES TOP SPOT IN JULY EILERS & KREJCIK – FANTINI REPORT
TaDa Gaming Releases Money Coming 2
-

 gaming3 years ago
ODIN by 4Players: Immersive, state-of-the-art in-game audio launches into the next generation of gaming
-
EEG iGaming Directory8 years ago
iSoftBet continues to grow with new release Forest Mania
-
News7 years ago
Softbroke collaborates with Asia Live Tech for the expansion of the service line in the igaming market
-
News7 years ago
Super Bowl LIII: NFL Fans Can Bet on the #1 Sportsbook Review Site Betting-Super-Bowl.com, Providing Free Unbiased and Trusted News, Picks and Predictions
-
iGaming Industry8 years ago
Rick Meitzler appointed to the Indian Gaming Magazine Advisory Board for 2018
-
News7 years ago
REVEALED: Top eSports players set to earn $3.2 million in 2019
-
iGaming Industry8 years ago
French Senator raises Loot Boxes to France’s Gambling Regulator
-
News7 years ago
Exclusive Interview with Miklos Handa (Founder of the email marketing solutions, “MailMike.net”), speaker at Vienna International Gaming Expo 2018
